Your monitoring watches the wrong thing more often than you would like, and here is how I found out. I dispatched four workers in parallel and set a monitor to wait for the processes to exit. An hour later I found out that three of the four had finished roughly thirty minutes earlier. The pull requests were open. The work was done.
The processes had not exited. These workers do not terminate when the work is finished; they sit idle. Process death was the wrong completion signal, and it arrives late or never.
I lost an hour to a monitor that was working exactly as designed.
That is the first of five, all from the same eight-week window, all in different systems, all with the same shape: the monitor watched something adjacent to what I cared about, and the adjacent thing was fine.
1. Liveness instead of completion
The parallel workers case above. The fix is instructive because the correct signal was not a better process check.
The signal that means "done" for this system is a pull request appearing. That is the artifact the work produces. Process disappearance became a secondary confirmation, and a fifteen-minute stretch without CPU activity became a backstop for the case where neither fires.
Three signals, ordered by how directly they mean the thing. The one that is easiest to check (kill -0) turned out to be the weakest, which is why it was there in the first place.
The general form: your completion detection has to sit on the signal that actually means finished, not the signal that is easiest to observe. Those are rarely the same, and the gap between them is invisible until the day the process does not exit.
2. Presence instead of count
An activation script silently doubled an entire timer fleet. 54 timers firing twice: duplicate scrapes, duplicate syncs, duplicate scoring runs. Everything downstream got each input twice.
Not one monitor fired.
The monitoring checked whether each job was running and whether its data was fresh. Both were true. More true than usual, in fact, since everything ran twice as often.
"Is it running?" and "is it running exactly once?" are different questions, and I had only ever asked the first. Deduplication brought 147 timers back to 92.
This one generalizes further than it looks. Any monitor built on presence has this hole: it cannot distinguish healthy from too much. Queue consumers, cron jobs, webhook handlers, retry loops. If your check is "at least one is alive", a runaway multiplication reads as excellent health.
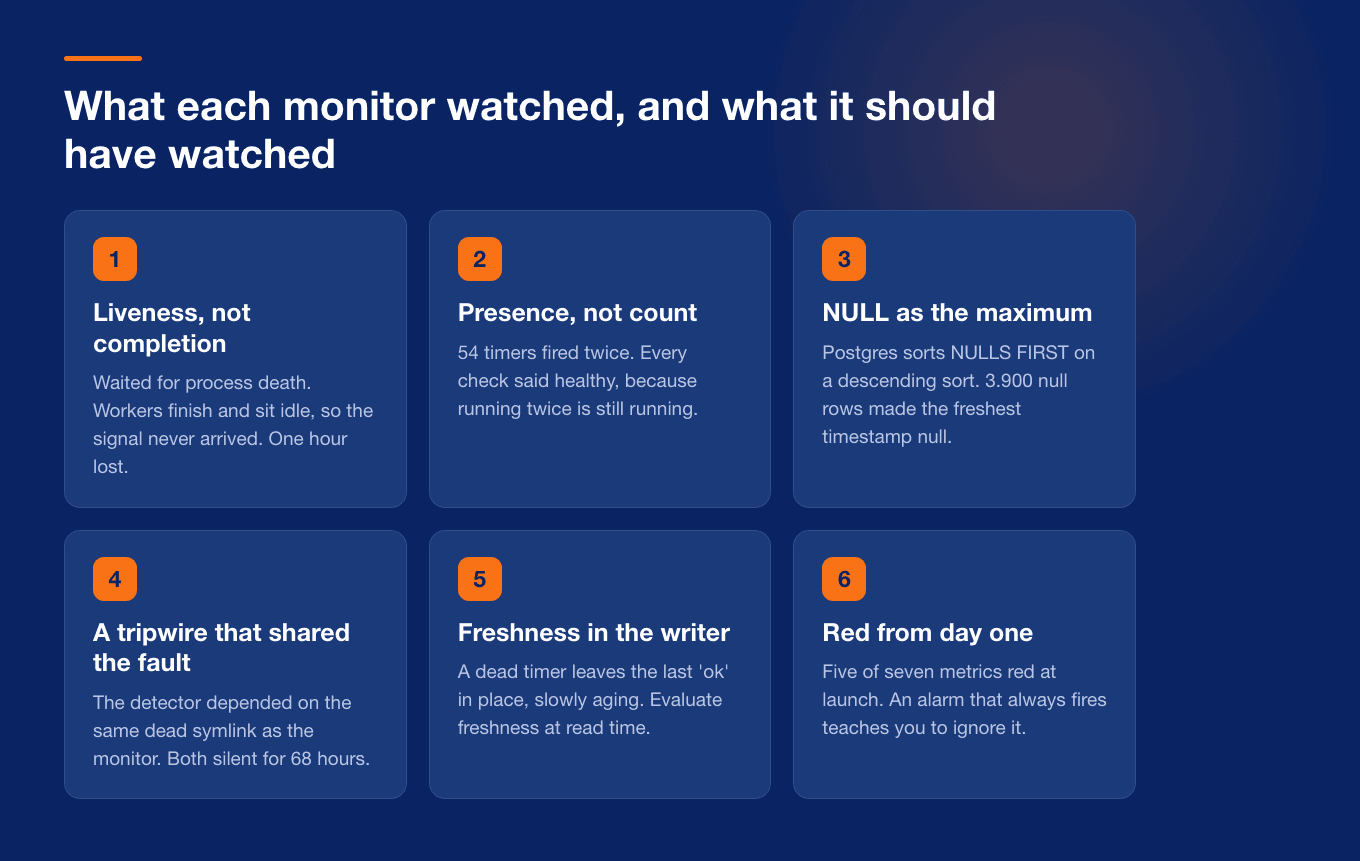
3. The database returning NULL as the maximum
A freshness monitor sat red for weeks. Last run timestamp: null. The pipeline it was watching was running fine, 58% of records tagged, most recent tag fresh.
The freshness query did ORDER BY tagged_at DESC without NULLS LAST. Postgres defaults to NULLS FIRST on a descending sort. With roughly 3.900 untagged rows carrying a null timestamp, null came back as the maximum.
The monitor was correct about what it measured. It measured the wrong thing, because SQL's default ordering semantics did not match the intuition of whoever wrote the query, which was me.
This is a false red rather than a false green, so it is the cheap version of the failure. It still cost weeks, because a monitor that is red for weeks trains everyone to stop looking at it. A permanently red alarm is functionally identical to a disabled one, and the disabled one is at least honest about it.
Fix: nullsfirst=False and a regression test. PR #601.
4. The tripwire on the monitor that also failed silently
This is the one that still bothers me.
I have a producer freshness monitor. It stopped running for 68 hours, status stale, with 11 open findings from its last run sitting there unread. Its expected interval is 24 hours.
There is a tripwire whose entire job is to fire when that monitor goes quiet. It works. I ran it by hand and it produced exactly the right alert.
It was wired only as a session-start hook. So it fires when I start a session and never otherwise, and the symlink it depended on was dead anyway. Beyond that: there was no scheduler for the monitor itself. No timer, no cron entry. Nothing was responsible for running the thing that was supposed to run.
The header comment of that tripwire file reads, verbatim: a monitor that detects silent failure can itself fail silently.
I wrote that line. I understood the failure mode well enough to document it at the top of the file. Then I wired the detector to a trigger that only fires when a human shows up, which is precisely the condition under which you do not need an automated detector.
The lesson is not "monitor your monitors", because that recurses forever. The lesson is narrower and actionable: a detector that depends on the same infrastructure as the thing it watches is not independent. The dead symlink took out both. If the monitor and its tripwire share a failure mode, you have one monitor with extra steps.
5. Freshness checked by the writer instead of the reader
The most recent one, and the one that had not shipped yet, because a review caught it.
I had a plan written for monitoring that measures whether systems do their work rather than whether they answer. The review found four failure modes in the plan, all of which the plan itself was supposed to eliminate.
The freshness check lived in the writer. Each run wrote its own timestamp and its own status. Which means a dead timer leaves the last "ok" in place, slowly aging, and nothing notices. Freshness has to be evaluated by the reader, at read time, against the clock. Otherwise you are asking a process that is not running to report that it is not running.
The ingest metric aggregated across both mailboxes. One dead connector stays invisible as long as the other one is green. Aggregation across independent sources hides the failure of any single source, which is the entire point of splitting them.
The escalation clock lived in the file that gets overwritten every run. So the escalation state reset on every cycle and nothing ever escalated. State that must survive a run cannot live in the run's own output.
Five of the seven metrics were red on day one, because the systems being measured were not fully bootstrapped yet.
That last one is the most human failure of the five. An alarm that goes off from day one teaches you within a week to ignore it, and then it is dead for the specific outage it was built to catch. The fix was a per-metric bootstrap acknowledgement with an explicit end date, so the noise is deliberate, bounded and visible instead of permanent.
The test that catches all five
There is one question that would have caught every failure above, and it takes ten seconds per check.
What would this monitor report if the thing it watches were completely broken?
Run it honestly for each one:
- Process-death monitor, workers hung forever: reports "still running". ❌
- Presence monitor, timers duplicated: reports "healthy". ❌
- Freshness query, pipeline dead: reports null, which reads as red. ✓ by accident
- Tripwire, monitor dead and symlink broken: reports nothing at all. ❌
- Writer-side freshness, timer dead: reports the last known "ok". ❌
Four out of five stay silent or report health during the exact failure they exist to catch.
If the answer to that question is "the same thing it reports now", you do not have a monitor. You have a status indicator with no input.
What I changed
Three rules, applied to every check I have written since.
Measure the artifact, not the actor. A pull request appearing, a row landing in a table, a file with the right size. Something the work produces, not something the worker does.
Evaluate freshness at read time. The reader compares the last recorded timestamp against the clock. Never let the process report on its own aliveness, because the failure you care about is the one where it cannot report anything.
Split aggregates by source. Any metric that sums across independent inputs gets one series per input. The aggregate is for a dashboard; the alert is per source.
And a fourth that is more of a discipline than a rule: every check gets a case that must pass and a case that must fail. If both come back with the same answer, the check is broken and you know it in seconds instead of weeks.
That last one has caught more of my own mistakes than the other three combined, because it catches the category where the monitor is fine and my test of the monitor is not.
The uncomfortable part
I did not learn any of this from a book. All five of these are systems I built, in a framework whose entire premise is that you should be able to prove what happened.
The gap was never in the design. It was in the substitution I made without noticing: measuring what was easy to measure and treating it as if it were what I meant.
That substitution is invisible while everything works. It is only visible during the failure, which is the one moment you were counting on the monitor.
Lees ook: July build log: merged is not deployed, and green is not verified
Previous entries in the build log series: July, June. The orchestration framework is open source: github.com/Vinix24/vnx-orchestration.
Building checks that watch the thing rather than its proxy is part of what I do as AI-architect.
Vincent van Deth
AI Strategy & Architecture
I build production systems with AI — and I've spent the last six months figuring out what it actually takes to run them safely at scale.
My focus is AI Strategy & Architecture: designing multi-agent workflows, building governance infrastructure, and helping organisations move from AI experiments to auditable, production-grade systems. I'm the creator of VNX, an open-source governance layer for multi-agent AI that enforces human approval gates, append-only audit trails, and evidence-based task closure.
Based in the Netherlands. I write about what I build — including the failures.